![]() Discriminant analysis plot
Discriminant analysis plot
|
|
Top Previous Next |
|
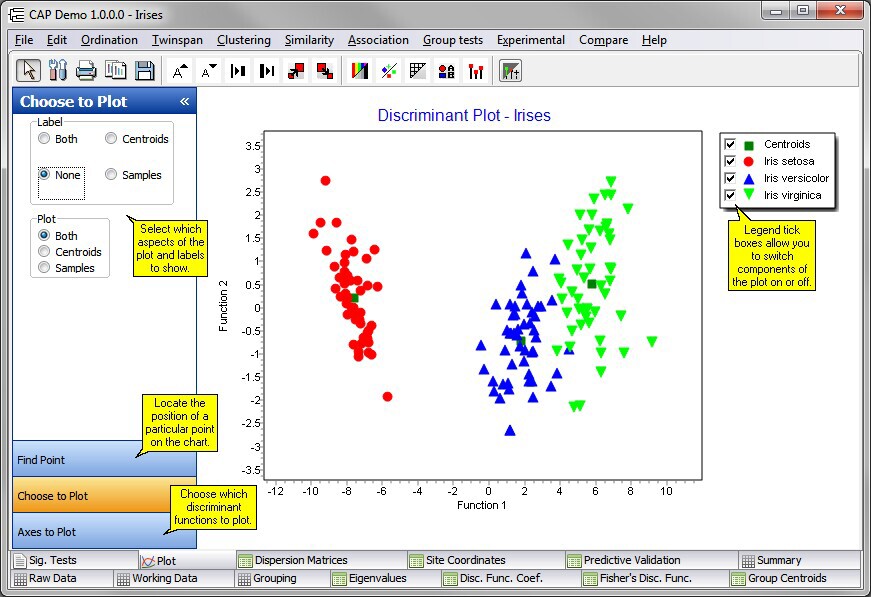
This window plots the discriminant scores for each sample, and also the centroid for each group.
The Label radio box is used to select labelling for the samples. Select: Both to label centroids and samples. Centroids to show the group name of the centroid. Samples to show the sample names. None to remove labels from the plot.
The Plot radio box allows the selection of centroids and samples for plotting.
The axes displayed in the plot are selected using the Plot x Axis, y Axis z Axis drop-down boxes on the Axes to Plot tab. The default is axis 1 and axis 2, which will display the relative positions of the samples using the scores for the two functions with the largest eigenvalues.
In two-dimensional plotting it is also possible to draw a perimeter line around the members of each predefined group.
See also |