![]() Zooming on charts
Zooming on charts
|
|
Top Previous Next |
|
Tight clusters of points which cannot be differentiated can occur in, for example, the PCA plot. To zoom in on an area, move to the top left corner of the area to be enlarged, then hold down the left hand mouse button and drag to the lower right hand corner of the area you require, and release the button. An enlarged view of the selected area will be displayed.
As you drag down from upper left to lower right corner of the area to be enlarged the area will appear as a coloured panel on the plot.
When you release the button this area will fill the plot. Using this zoom facility can allow you to read labels and distinguish points that are very close together.
To return to the original view, hold down the left hand mouse button and move upwards from the lower right to the upper left corner and release.
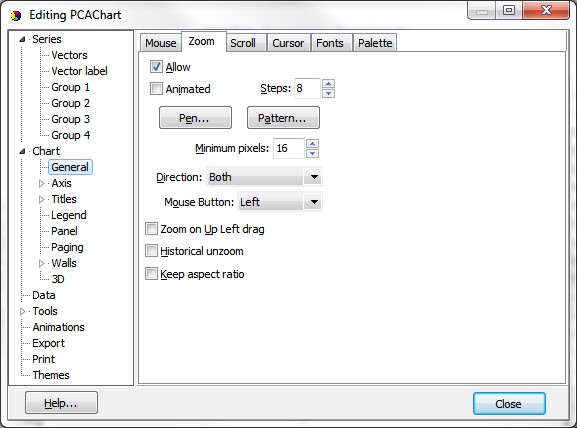
All aspects of zooming behaviour can be edited; click the Edit Chart button, and on the Editing Chart dialong choose Chart: General: Zoom:
|