![]() Drawing a perimeter
Drawing a perimeter
|
|
Top Previous Next |
|
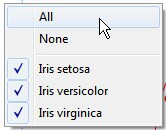
It is possible to display the perimeter of each predefined group. Right-click on the plot to display a menu that enables you to choose which group(s) you wish to outline. Remember you must have already defined group membership.
In this example, we have carried out a PCA-Correlation on the Irises demo data set. Select from the menu which groups you wish to add a perimeter to. Here is the result:
Note this line is dynamically created and will need to be refreshed if any other changes are made to the plot, such as changing the colour of the data points. This option is also available in 3D plotting, but may not be helpful, depending on the nature of the plot.
|