This form shows the resulting calculations for a Jolly-Seber model with constant survival and probability of capture.
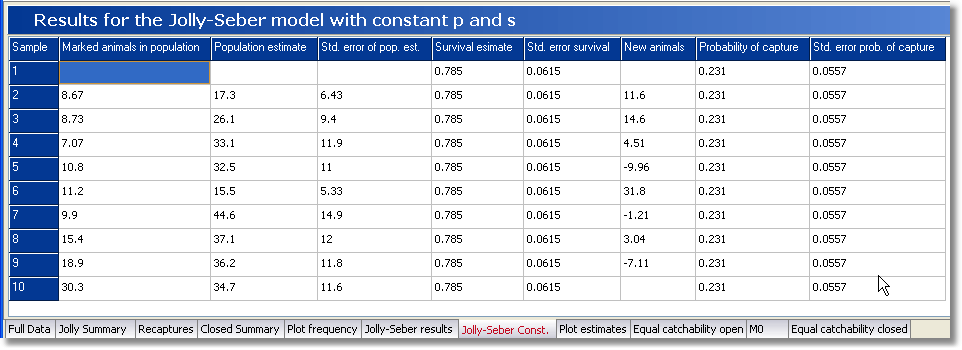
The parameter estimates are arranged in columns, with the rows representing each of the sampling occasions:
Column 1 gives the sample number.
Column 2 gives the estimated number of marked animals in the population.
Column 3 gives estimated size of the population.
Column 4 gives the standard error of the population estimate.
Column 5 gives estimates of the proportion of the population surviving between samples. This will not change as a constant survival is assumed.
Column 6 gives the standard error of the survival estimates.
Column 7 gives the estimate of the new animals entering the population. A negative number occurs when there has been a net loss of animals.
Column 8 gives the estimated probability of capture for each sample. This will not change as a constant probability of capture is assumed.
Column 9 gives the standard error of the probability of capture estimate.
A plot of the population size through time (at the times when samples were taken) plus their 95% confidence limits is obtained by clicking on the Plot estimates tab.
See also:
Printing or exporting your results