![]() Improvements implemented in CAP 5.0 (2014)
Improvements implemented in CAP 5.0 (2014)
|
|
Top Previous Next |
|
A wide range of new features were added for most of the methods.
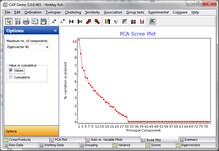
1. The methods for selecting and editing group membership were extensively developed. 2. New dendrogram plotting options were implemented. 3. In PCA: a scree plot showing how the fraction of total variance in the data is explained or represented by each Principal Component.
A scree plot offered by PCA
4. Multidimensional scaling plots were improved so that a bubble plot showing the relative abundance of a selected variable in each sample can be displayed. This shows the contribution of the species to the ordination.
An example of a bubble plot generated using the Hinkley fish demo data set.
5. New data exploration options, Profile Plot, Scatter Plot and Matrix Plot.
6. Completely new Print Preview for dendrograms and charts.
7. The video guides were removed from the program, and are now hosted on YouTube. |