![]() Matrix Plot
Matrix Plot
|
|
Top Previous Next |
|
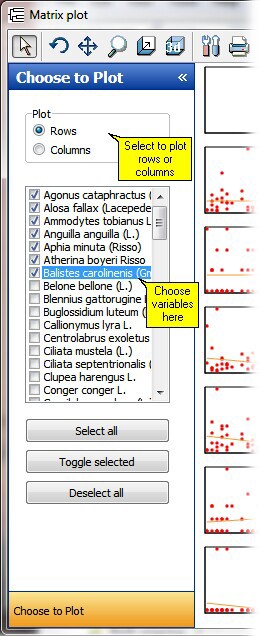
Use this option to look at the relationship between a number of variables (species) or samples simultaneously. The program will not allow you to choose more than 15 variables at once, as the resultant plot would take a very long time to produce, and would not be viewable.
The following demonstration output is for the first 6 fish (alphabetically by Latin name) in the hinkley fish data set. The yellow lines on the plots are linear regression plots. These will help to point out the variables that are positively or negatively correlated.
|