![]() Highlighting Individual Parameters
Highlighting Individual Parameters
|
|
Top Previous Next |
|
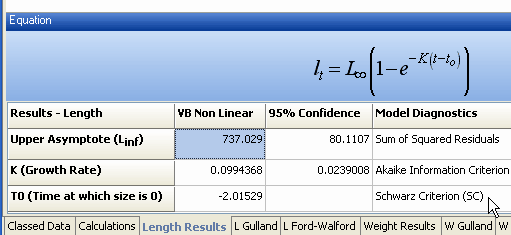
When any model is run the results are presented together with the fitted equation as shown below.
To help you understand which parameter the different estimates refer to, you can highlight each parameter in turn by left button clicking on the parameter name in column 1 of the grid or the result in column 2. This will result in the parameter name and symbol in the equation both being highlighted in red.
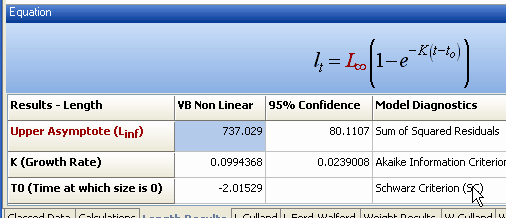
For example, using the bass.csv data set and running a von Bertalanffy growth curve, to highlight the upper asymptote in the equation, left-click on the Upper Asymptote in the grid:
then the following is displayed:
|