![]() Diversity Ordering tutorial
Diversity Ordering tutorial
|
|
Top Previous Next |
|
It is possible for a data set to give inconsistent results for alpha diversity indices, in that sample 1 will have a higher diversity than sample 2 using one index, but sample 2 will be higher than sample 1 with another index. This is because of the different weighting indices give to species number and relative species abundance. We show you here how to identify such an inconsistency.
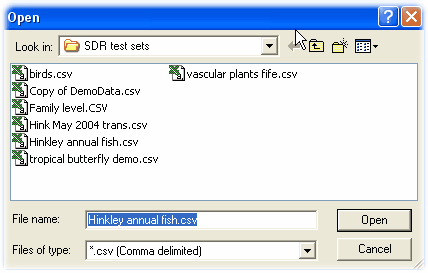
First open the data set called Hinkley annual fish.csv
This data set is for the fish community of the Bristol Channel, England. It is derived from monthly sampling over a 25 year period and is one of the largest data sets of its type available.
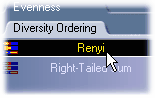
Now from the Diversity Ordering tab choose Renyi.
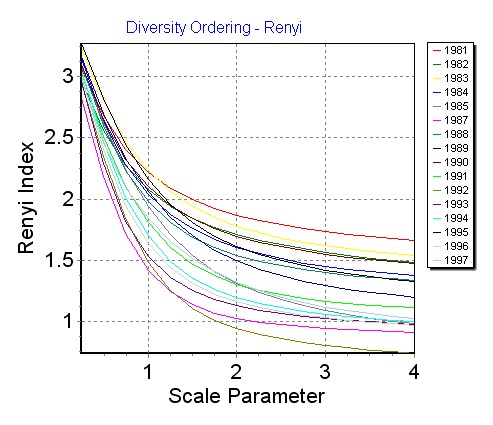
A graph showing the diversity ordering for each sample will be shown as follows:
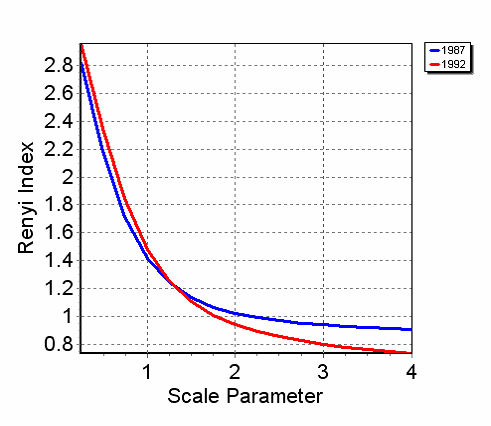
To identify inconsistencies in alpha diversity indices we must look for lines that cross. While this plot is confusing because of the number of lines that have been plotted (we will reduce them shortly) it can be seen that the bottom two lines (1987 and 1992) cross between a scale parameter of 1 and 2. This indicates that samples for these two years will be inconsistent for their Shannon, H, and Simpson's D indices.
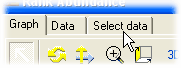
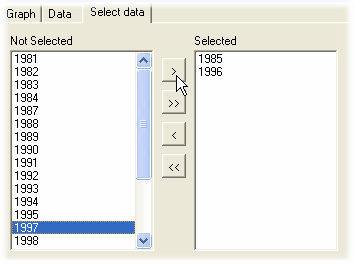
This plot is too cluttered, so you cannot see the difference between years. To select the samples (years) to plot, click on the Select Data tab at the top of the graph.
Now select 1987 and 1992 only using the selection buttons between the two boxes which hold the not selected and selected samples.
Now click on the Graph tab to display the graph for 1987 and 1992. The resulting graph clearly shows the inconsistency in alpha diversity between the two years.
You can check that this inconsistency is true by looking up the alpha diversity Shannon and Simpson values for 1987 and 1992 using the Alpha diversity tab. The results are as follows:
1987: H = 1.42; D = 2.778 1992: H = 1.49; D = 2.564
|