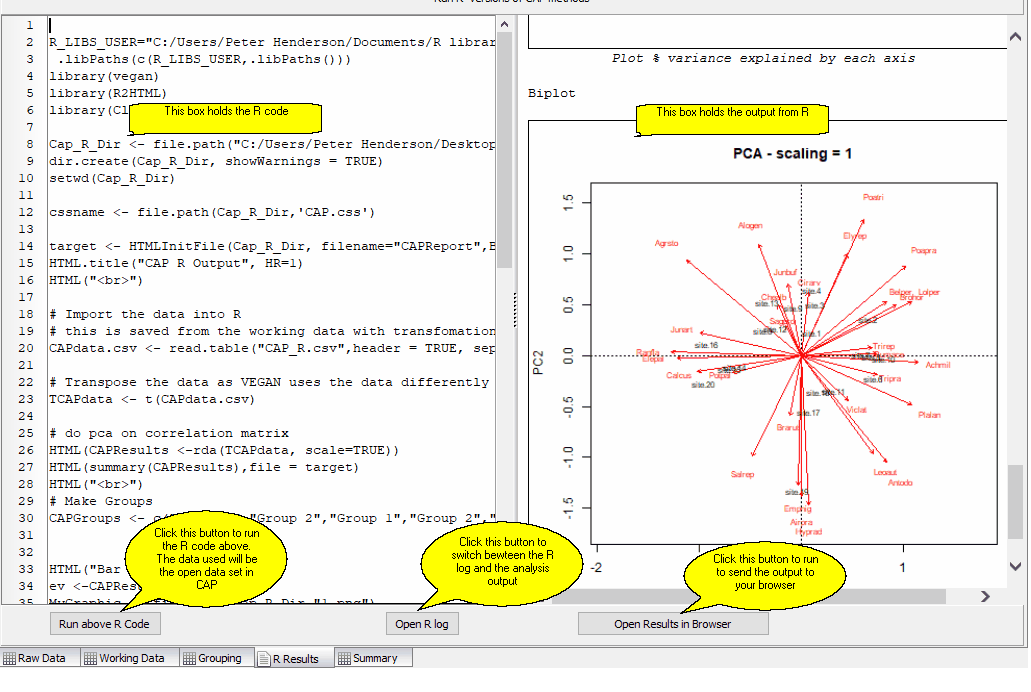
Select PCA - Covariance to run a Principal Component Analysis using the variance-covariance matrix. The vegan package in R is used.
The data set used will be your working data.
The relationship between samples (columns) in terms of their variables cannot normally be visualised because this would require a plot with as many axes as there are variables (rows). If your study only includes 3 variables this is possible, but is quite impossible given 4 or more variables or species. PCA is a technique that may summarise the relationship between the samples in a small number of axes that can be plotted. For such a summarisation to work, there must be some degree of correlation between the descriptive variables so that the effect of a number of these variables can be combined into a single axis. For good general introductions to PCA for non-mathematicians see Kent & Coker (1992) and Legendre & Legendre (1983).
