Having completed a Principal Component Analysis (PCA) it is sometimes useful to consider if any of the observations are significantly different from the others.
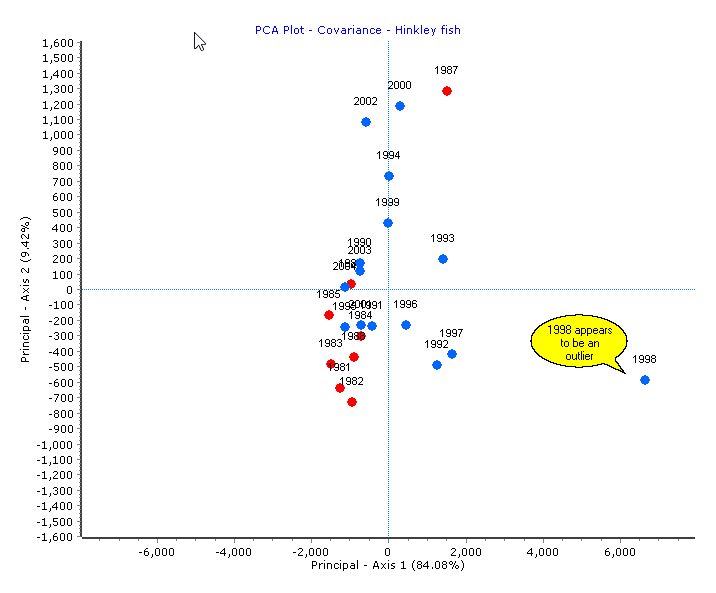
For example, in the PCA plot below Hinkley fish data for 1998 seems to be notably different from other years.
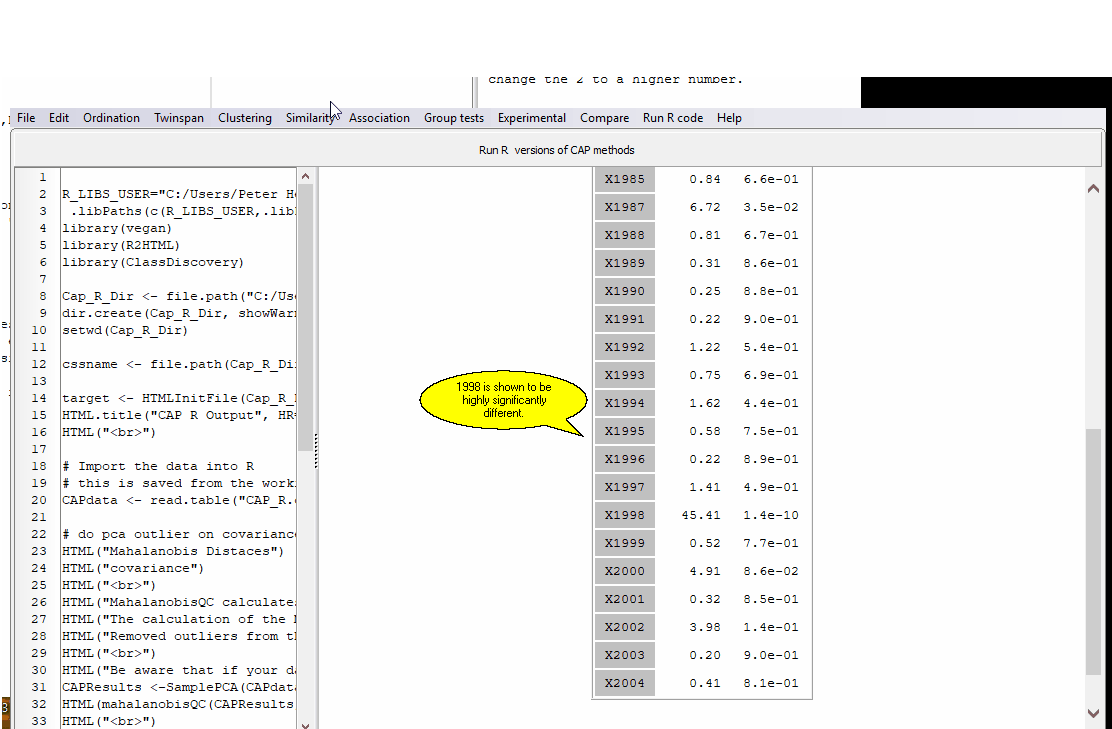
This R code undertakes an outlier analysis using the variance - covariance matrix values between the variables. The Mahalanobis distance is used. The default calculations are undertaken using the two largest principal components. This can be changed - see image.

