![]() Group Centroids - DA
Group Centroids - DA
|
|
Top Previous Next |
|
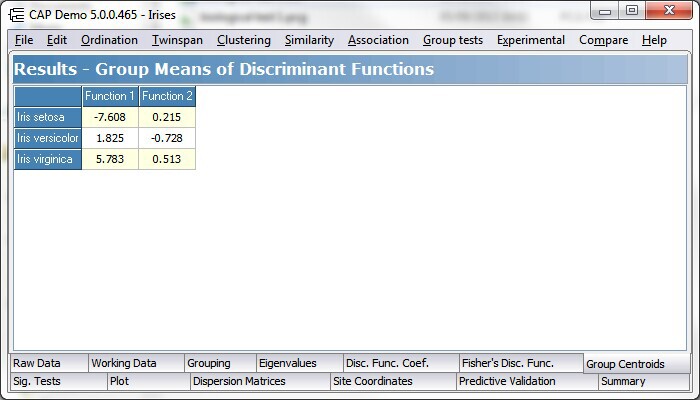
The Group Centroids tab tabulates the mean values (centroids) of the discriminant functions for each group. To have groups that are clearly different, the means need to be spaced well apart.
See Printing and exporting text to save or print this table.
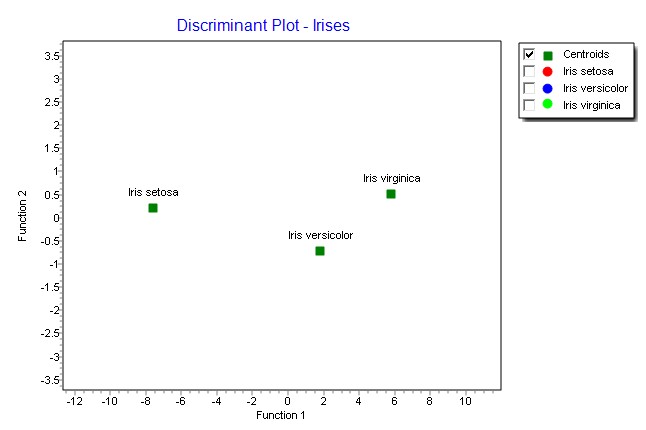
CAP also plots these centroids; see the plot below:
|